DGS Commander EDM Screens: Difference between revisions
Jump to navigation
Jump to search
No edit summary |
No edit summary |
||
| Line 1: | Line 1: | ||
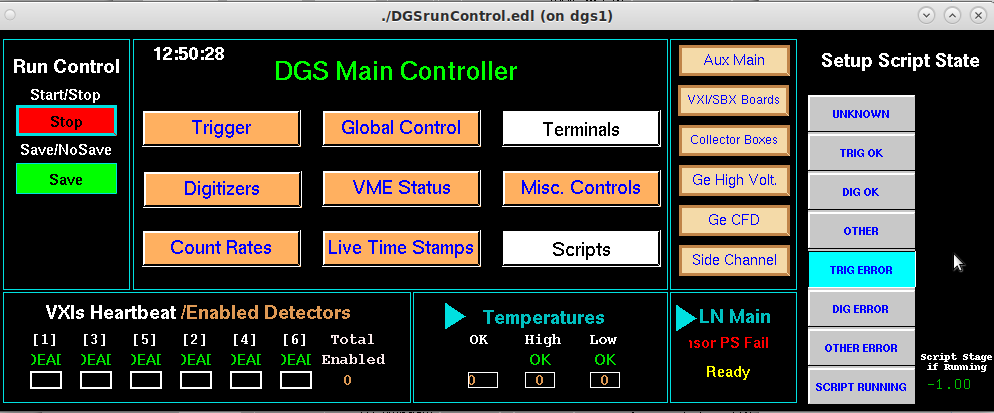
'''This is an interactive image map of the DGS Commander EDM screens.''' EDM, the “Extensible Display Manager”, is the interface used for researchers to control and monitor their experiments with [[Gammasphere]]. Click on text in the picture (these are buttons on the GUI) to proceed to the next screen. This allows you to explore the [[DAQ system]] controls without accidentally changing something during experimental operation. '''Note that a lot of the information provided on the screens is duplicitous. There is a lot of the same information presented throughout these screens in different ways.''' | '''This is an interactive image map of the DGS Commander EDM screens.''' EDM, the “Extensible Display Manager”, is the interface used for researchers to control and monitor their experiments with [[Gammasphere]]. Click on text in the picture (these are buttons on the GUI) to proceed to the next screen. This allows you to explore the [[DAQ system]] controls without accidentally changing something during experimental operation. '''Note that a lot of the information provided on the screens is duplicitous. There is a lot of the same information presented throughout these screens in different ways.''' | ||
The main screen below has 7 sections. | |||
*Run Control: The Start/Stop and Save/NoSave buttons control data acquisition and data writing. | |||
*Main Controller: The main controller holds different control and monitoring screens for waveform specifications, hardware, timing, and more. | |||
*Main Controller Side Panel: The side panel, between the main controller area and setup script state, is an extension of the main controller. | |||
*VXI Heartbeat/Enabled Detectors: This area of the main screen is obsolete and was utilized as part of the previous DAQ system prior to upgrades. | |||
*Temperatures: Monitoring screen for viewing the temperatures of each detector, and making sure they stay within a certain range. | |||
*LN Main: The screens for maintain and monitoring the LN system. | |||
*Setup Script State: An indicator part of the screen for scripts that can be run on the main controller. | |||
<imagemap> | <imagemap> | ||
Image:MainCommander.png|frame|center | Image:MainCommander.png|frame|center | ||
Revision as of 17:30, March 17, 2023
This is an interactive image map of the DGS Commander EDM screens. EDM, the “Extensible Display Manager”, is the interface used for researchers to control and monitor their experiments with Gammasphere. Click on text in the picture (these are buttons on the GUI) to proceed to the next screen. This allows you to explore the DAQ system controls without accidentally changing something during experimental operation. Note that a lot of the information provided on the screens is duplicitous. There is a lot of the same information presented throughout these screens in different ways.
The main screen below has 7 sections.
- Run Control: The Start/Stop and Save/NoSave buttons control data acquisition and data writing.
- Main Controller: The main controller holds different control and monitoring screens for waveform specifications, hardware, timing, and more.
- Main Controller Side Panel: The side panel, between the main controller area and setup script state, is an extension of the main controller.
- VXI Heartbeat/Enabled Detectors: This area of the main screen is obsolete and was utilized as part of the previous DAQ system prior to upgrades.
- Temperatures: Monitoring screen for viewing the temperatures of each detector, and making sure they stay within a certain range.
- LN Main: The screens for maintain and monitoring the LN system.
- Setup Script State: An indicator part of the screen for scripts that can be run on the main controller.
Go back to Advanced User Guides
Go back to Digital Gammasphere Upgrade Project

