Well to Pump Results: Difference between revisions
No edit summary |
No edit summary |
||
| Line 1: | Line 1: | ||
The well to pump results allow viewing and comparing the energy usage and emission results for each of the pathways in each of the mixes for a LDV fuel. | The well to pump results allow viewing and comparing the energy usage and emission results for each of the pathways in each of the mixes for a LDV fuel. This displays the aggregate energy usage and emissions results for the simulation for any pathways that are selected. | ||
==Graphical Representation== | ==Graphical Representation== | ||
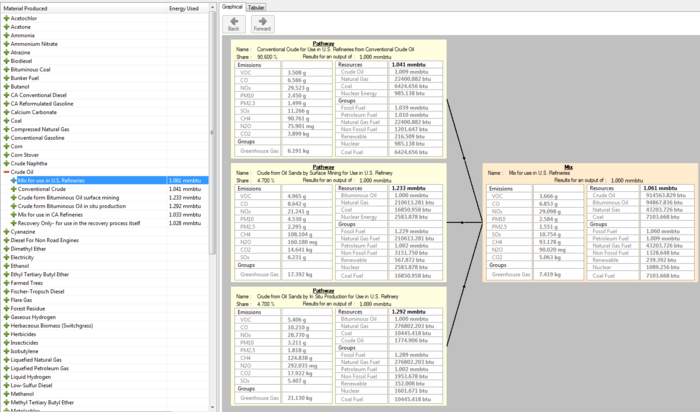
[[File:WellToPumpResultsGraphical.png|thumb|none|700px|Well to pump results in graphical format]] | [[File:WellToPumpResultsGraphical.png|thumb|none|700px|Well to pump results in graphical format]] | ||
The graphical format of the results allows seeing the pathways as they feed into a mix of the resulting LDV fuel. Each of the pathways | The graphical format of the results allows seeing the pathways as they feed into a mix of the resulting LDV fuel. Each of the pathways displayed on the left of the graphic with their name and share amount as well as the emissions displayed on the left of the panel and the energy displayed on the right. The source box then shows the weighted mix results from combining the output of the pathways. | ||
==Tabular Representation== | ==Tabular Representation== | ||
| Line 10: | Line 10: | ||
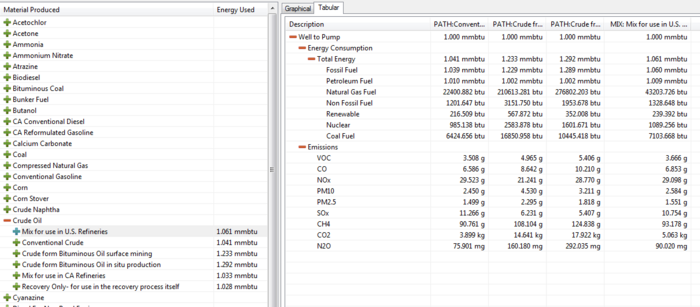
The tabular version of the results displays the energy usage and emissions for each pathway as well as the weighted average of the values based on the share of each pathway. The pathways that are displayed depends on what is selected on the left material selection control. Hold shift or control and then select another pathway to choose which pathways are shown. If the resulting material is selected then each pathway within each mix is displayed on the right as well as the weighted results for the mix. The column header represents this by starting with either "PATH" for pathway results or "SRC" for the mix results. Selecting a single pathway will display the energy used and emissions for each process within the pathway each denoted by "PROC" in the result table. The results can be exported by right clicking and selecting "Copy to Clipboard" or "Save to XML File". Once copied the results can either be pasted into Excel or a text editor. | The tabular version of the results displays the energy usage and emissions for each pathway as well as the weighted average of the values based on the share of each pathway. The pathways that are displayed depends on what is selected on the left material selection control. Hold shift or control and then select another pathway to choose which pathways are shown. If the resulting material is selected then each pathway within each mix is displayed on the right as well as the weighted results for the mix. The column header represents this by starting with either "PATH" for pathway results or "SRC" for the mix results. Selecting a single pathway will display the energy used and emissions for each process within the pathway each denoted by "PROC" in the result table. The results can be exported by right clicking and selecting "Copy to Clipboard" or "Save to XML File". Once copied the results can either be pasted into Excel or a text editor. | ||
==Internal Links== | |||
* [[How_to|How to]] | |||
* [[Use_Resources_Mix|Mix description]] | |||
Revision as of 17:00, January 19, 2012
The well to pump results allow viewing and comparing the energy usage and emission results for each of the pathways in each of the mixes for a LDV fuel. This displays the aggregate energy usage and emissions results for the simulation for any pathways that are selected.
Graphical Representation
The graphical format of the results allows seeing the pathways as they feed into a mix of the resulting LDV fuel. Each of the pathways displayed on the left of the graphic with their name and share amount as well as the emissions displayed on the left of the panel and the energy displayed on the right. The source box then shows the weighted mix results from combining the output of the pathways.
Tabular Representation
The tabular version of the results displays the energy usage and emissions for each pathway as well as the weighted average of the values based on the share of each pathway. The pathways that are displayed depends on what is selected on the left material selection control. Hold shift or control and then select another pathway to choose which pathways are shown. If the resulting material is selected then each pathway within each mix is displayed on the right as well as the weighted results for the mix. The column header represents this by starting with either "PATH" for pathway results or "SRC" for the mix results. Selecting a single pathway will display the energy used and emissions for each process within the pathway each denoted by "PROC" in the result table. The results can be exported by right clicking and selecting "Copy to Clipboard" or "Save to XML File". Once copied the results can either be pasted into Excel or a text editor.

