Quick start guide: Difference between revisions
| (48 intermediate revisions by 3 users not shown) | |||
| Line 1: | Line 1: | ||
=How to | =How to Install and Run GREET= | ||
==Running GREET== | ==Running GREET== | ||
| Line 14: | Line 14: | ||
After selecting OK on the message a window will open for selecting the location of the data folders. Navigate to where the "Pictures","Log", and "Data" folders are on your system and select the folder directly above these folders then select OK. The program will load the data files and display the graphical user interface (GUI). | After selecting OK on the message a window will open for selecting the location of the data folders. Navigate to where the "Pictures","Log", and "Data" folders are on your system and select the folder directly above these folders then select OK. The program will load the data files and display the graphical user interface (GUI). | ||
==Copying/Moving Data Folders== | |||
To copy the data folders to a new directory select copy on the directory containing the "Data", "Log", and "Pictures" folders and paste it to a new location. This allows customizing where on the computer the program/data is stored. | |||
=Using the GUI= | =Using the GUI= | ||
| Line 19: | Line 23: | ||
The GUI separates the key points of setting parameters and viewing results into various controls accessible through the buttons at the top of the main GUI window. | The GUI separates the key points of setting parameters and viewing results into various controls accessible through the buttons at the top of the main GUI window. | ||
[[File: | [[File:StepsBarWithPictures.png|thumb|700px|center]] | ||
This image shows the main navigation of the program. Each of the main views can be selected by clicking one of the large buttons on the step bar. In the toolbar the "File" dropdown exposes options for loading and saving GREET projects. The "Results" dropdown shows options for manually recalculating the results and monitoring values. From the "Preferences" dropdown the preferences window can be shown and the table editor can be opened. From the "About" dropdown database information can be viewed, the software can be updated, and the help pages can be opened. | |||
==Preferences== | |||
The main preference pages are the unit and calculation preferences accessible through their associated tabs within the preference window. The unit page, visible below, allows selecting desired units for various groups. Changing the value in the User defined column will cause values of that unit group to be displayed with the selected unit. If a group is made up of multiple units groups then the units can be changed within each group. An example of this is the first unit in the image below where Energy Intensity is composed of Energy over Distance over Mass. | |||
[[File:PreferencesUnits.png|thumb|300px|left]] | |||
[[File:PreferencesCalculations.png|thumb|310px|none]] | |||
The calculations tab provides various options for controlling how the calculations are executed and displayed. The "Running Options" group of options allows changing calculation parameters such as the maximum iterations to run for calculating upstream values. | |||
==Main views== | ==Main views== | ||
[[File:StepsBar.png|thumb|700px|center]] | |||
This image shows the main views, mousing over a button will display the text as shown or displaying the images can be disabled from the preferences. | |||
===Basic Parameter Setup=== | ===Basic Parameter Setup=== | ||
This control allows modifying many of the simulation parameters within various tables such as which year to simulate. The tables have a title explaining more about what the table is used for and the cells display the various values. A light blue cell indicates that the value comes from a formula referencing other table values which can be viewed or modified by right clicking and selecting "Edit Formula". Each value stores a default number and an current number which can be swapped by selecting "Switch to default value" and "Switch to user value" from the right click menu. This allows making changes and easily returning to a default value. For most cells the value has an associated unit which can be modified from the right click menu by selecting "Change Unit" and then selecting the desired units. | |||
[[File:BasicParameterSetup.png|thumb|none|500px|The Basic Parameter Setup Control]] | |||
===Well to Pump Setup=== | ===Well to Pump Setup=== | ||
This allows viewing and modifying parameters specific to processes as well as pathways. | |||
====Pathway Selection==== | |||
The tree selection in the top left allows selecting a pathway which are organized into light duty vehicle (LDV) fuels, feedstocks, and others. Fuels that make up a family of actual fuels are denoted by a lighter teal color such as Diesel and Gasoline which have multiple fuels under those names. Under each fuel are mixes which represent a particular blend of fuels. Under each mix is one or more pathways which output a fuel that goes into the mix and next to it is the share that the fuel contributes to the mix. | |||
====Pathway Representation==== | |||
The large panel on the right with boxes is a graphical representation of the selected pathway. If the pathway has a fuel that feeds into it then the feed panel will be on the left denoted by a light orange background. After the calculations have been run this panel displays a summary of energy and emissions for the feed mix when the mouse is moved over it. Clicking the title link will display the feed pathway and the back button on the pathway selection control allows returning to the previous pathway. | |||
To the right of the feed are the processes with Stationary Processes showing with a light blue background and Transportation Processes with a pink background. Double clicking a Stationary Process expands the process to display the process fuels consumed in the process and if a fuel has technologies associated with it then it can be expanded to view the technologies. Double clicking a transportation process expands the process to display a graphical representation of the locations and modes that represent the transporting of the material to the destination. Double upward arrows next to a process represent a loss (leakage or boil-off) which can be displayed by clicking the arrows. Various parameters can be set for each process and the titles in blue can be used to open a window with more parameters for that object. | |||
====Property Display==== | |||
The bottom left control displays properties for the selected object in the pathway representation. The pathway summary can also be display by clicking the "Switch to pathway" button. The emissions section displays how much of each gas emission is released and is also broke down intro all included and partial upstream. | |||
For ease of use the emissions are shown in the groups criteria pollutants, emission gases, from combustion, and greenhouse gases. The energy is broken down into upstream included and partial upstream as well as displaying energy per process fuel. In addition it is grouped into fossil, petroleum, natural gas, coal, non fossil, nuclear, and renewable fuels. If a loss is as is associated with the selected process then it will display in the losses section. | |||
[[File:WellToPumpSetup.png|thumb|none|700px|The Well to Pump Setup control]] | |||
===Well to Pump Results=== | ===Well to Pump Results=== | ||
The well to pump results allow viewing and comparing the energy usage and emission results for each of the pathways in each of the mixes for a LDV fuel. | |||
[[File:WellToPumpResultsTabular.png|thumb|none|700px|Well to pump results in table format]] | |||
The tabular version of the results displays the energy usage and emissions for each pathway as well as the weighted average of the values based on the share of each pathway. The pathways that are displayed depends on what is selected on the left material selection control. If the resulting material is selected then each pathway within each mix is displayed on the right as well as the weighted results for the mix. The column header represents this by starting with either "PATH" for pathway results or "SRC" for the mix results. Selecting a single pathway will display the energy used and emissions for each process within the pathway each denoted by "PROC" in the result table. The results can be exported by right clicking and selecting "Copy to Clipboard" or "Save to XML File". Once copied the results can either be pasted into Excel or a text editor. | |||
[[File:WellToPumpResultsGraphical.png|thumb|none|700px|Well to pump results in graphical format]] | |||
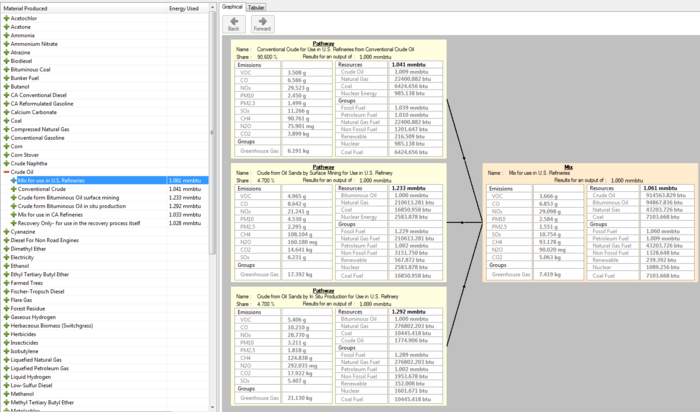
The graphical format of the results allows seeing the pathways as they feed into a mix of the resulting LDV fuel. Each of the pathways display on the left of the graphic with their name and share amount as well as the emissions displayed on the left of the panel and the energy displayed on the right. The source box then shows the weighted mix results from combining the output of the pathways. | |||
===Pump to Wheels Setup=== | ===Pump to Wheels Setup=== | ||
This control allows setting assumptions for vehicles to be used in the well to wheels simulation. The vehicles or sorted by the LDV fuel that they run on and can be selected from the list on the left. The parameters for that vehicle will display on the right. | |||
[[File:PumpToWheelsSetup.png|thumb|none|700px|Vehicle Setup Control]] | |||
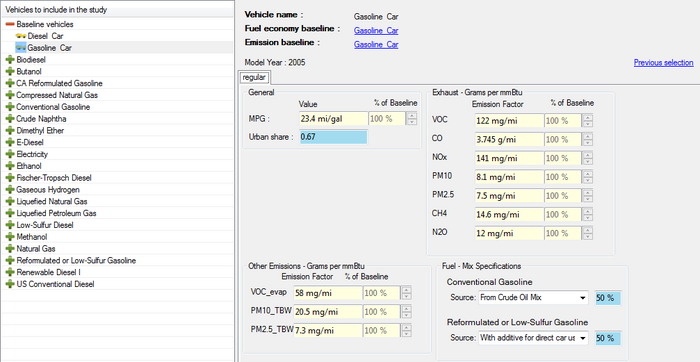
A "normal" or "cs" vehicle displays parameters for a combustion engine vehicle as shown above. Many of the vehicles' parameters are based on a baseline vehicle in which case the "% of baseline" columns will be active and changes to values in emissions or miles per gallon will adjust the % of the baseline according for that parameter. | |||
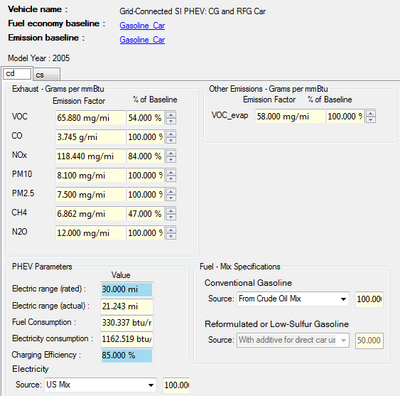
[[File:PumpToWheelsSetupCD.png|thumb|none|400px|CD parameters for hybrid electric vehicles]] | |||
The "cd" control displays options for plug-in hybrid electric vehicles (PHEV). The primary attributes for PHEVs are the electric range, fuel consumption, electricity consumption, charging efficiency, and the source mix for electricity. | |||
===Well to Wheels Results=== | ===Well to Wheels Results=== | ||
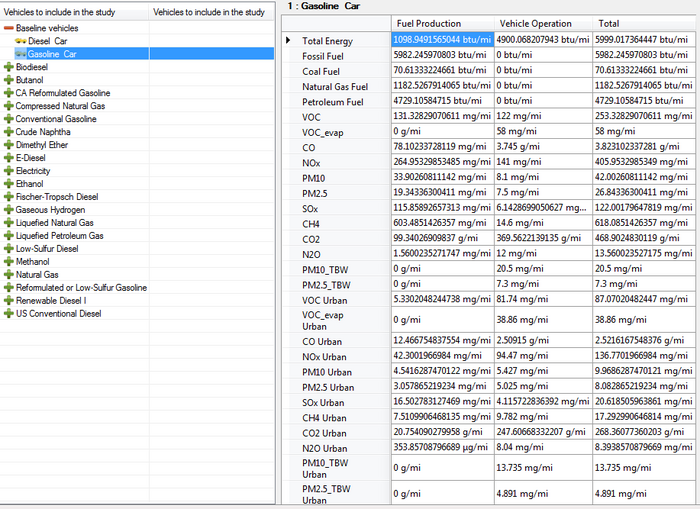
[[File:WellToWheelsResults.png|thumb|none|700px|Well to Wheels Results Control]] | |||
===Data Editor=== | ===Data Editor=== | ||
[[File:DataEditorSelection.png|thumb|none|700px]] | |||
The controls in the data editor allow direct access to the data stored within the model including the pathways, processes, resources, and more. Many of the controls are linked to from other places such as clicking the name of a process within the well to pump setup and the resulting process editor being opened in a new window. | |||
For detailed information on any of the controls see the Full User Manual under Data Editor. | |||
=Example study= | |||
==Gasoline Production - Well to Wheels== | |||
This part of the guide will run through carrying out a simulation for production of gasoline and combustion in a gasoline car. | |||
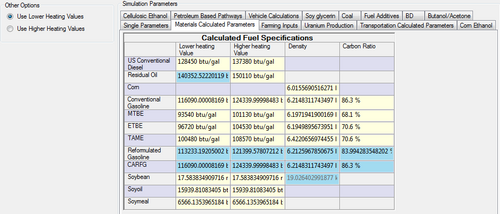
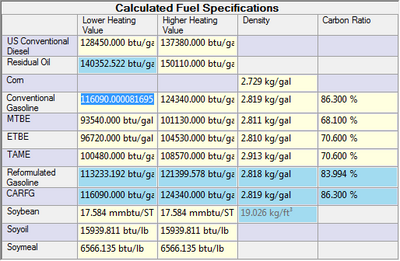
First start with the "Basic Parameter Setup" and look through the simulation parameters for tables related to conventional gasoline as well as general parameters. This simulation will use the default simulation year of 2010 which is in the "single parameters" tab. Next look through the "Materials Calculated Parameters" tab for Conventional Gasoline which shows assumptions about the fuel. If you have different assumptions for the density or heating value they could be inputted here. Also note the "Other Options" section to the left of the tables as this option determines whether the lower heating value or upper healing value is used for calculations. | |||
[[File:CalculatedFuelSpecifications.png|thumb|400px|none]] | |||
The "Transportation Calculated Parameters" table can be used to set parameters for the modes of transportation for the fuel such as average speed and load factor of an ocean tanker carrying crude oil. Additional mode options can be accessed from the data editor under "Edit Modes". | |||
[[File:TransportationModeOptions.png|thumb|600px|none]] | |||
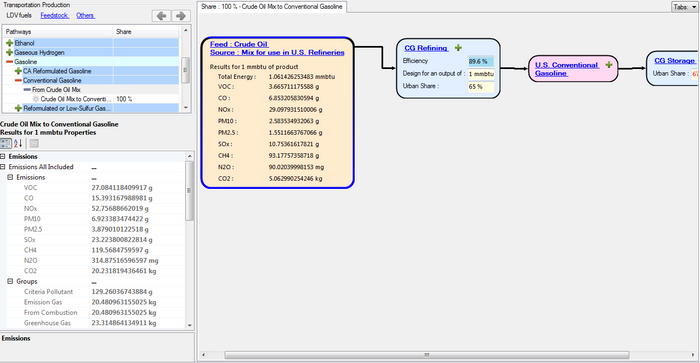
Moving to the well to pump setup control from the top navigation bar, the Gasoline mixes are found under the "Gasoline" group in the pathway selection. Navigating down to a mix under "Conventional Gasoline" it shows that there is currently one mix stored called "From Crude Oil Mix" and selecting it displays the pathway. | |||
By hovering the mouse of the Feed box, which is tan colored, the energy and emission results for the feed mix pathways are displayed in a drop down summary of the pathways. Clicking the feed name redirects this control to the first feed pathway and selects displays the mix in the pathway selection. Doing this for this CG feed there are three pathways in the mix that feeds into the "From Crude Oil Mix", those being conventional crude oil at 90.6%, crude oil from oil sands at 4.7%, and crude oil from surface mining at 4.7%. The shares show how much weight each pathway has on the results for that mix. | |||
Clicking the back button brings me back to the CG pathway where three processes are visible. The stationary processes, the light blue ones, can be expanded by double clicking in order to set parameters for the process fuels and their technologies. | |||
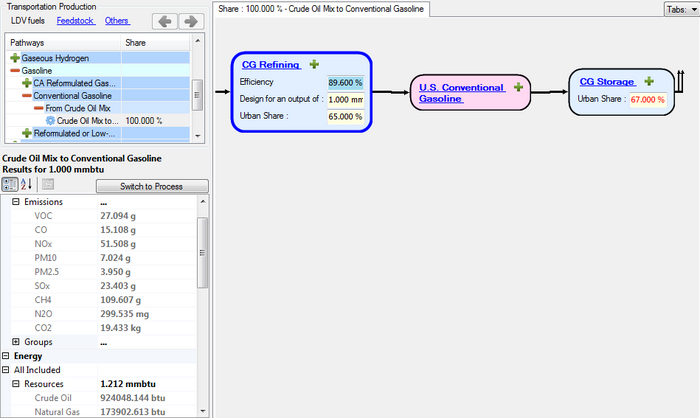
[[File:WellToPumpSetupCG.png|thumb|700px|none]] | |||
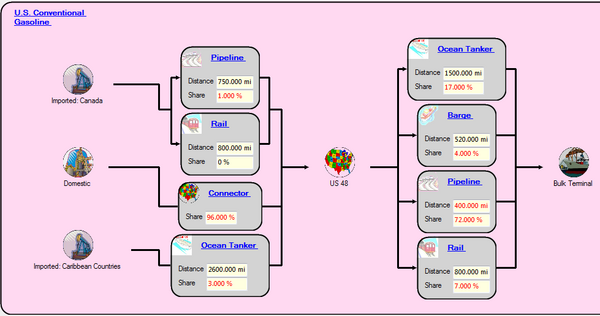
Expanding a transportation process, the pink colored processes, displays the transportation breakdown for the fuel. The starting locations where the conventional gasoline is being moved from are displayed at the far left followed by a series of transportation modes for representing how the resource will be moved. The distance can be set for the estimated distance that mode will travel, the share specifies how much of the total transported material will be moved using that mode, and clicking the mode name link will open a form for setting other parameters such as fuel shares and energy intensities. | |||
[[File:CGTransportation.png|thumb|600px|none]] | |||
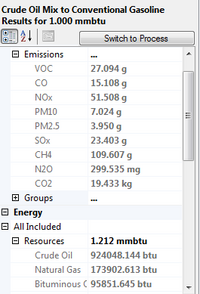
At the bottom left the results for various objects can be displayed. Simply select a process, input under a process, or transportation step to view the emissions and energy used for that object. The "Switch to Pathway" button can be used to go back to the pathway results. | |||
[[File:CGPathwayResults.png|thumb|200px|none]] | |||
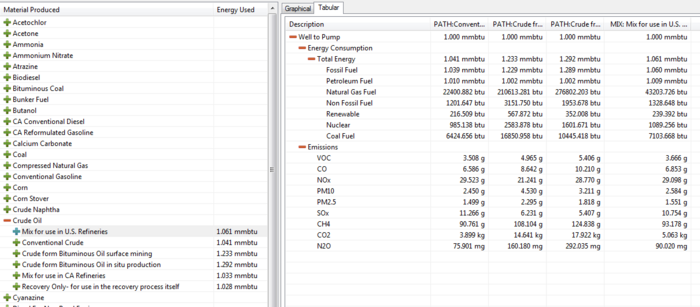
Moving to the "Well to Pump Results" page shows the cumulative emissions and energy used for the Crude oil mix to conventional gasoline pathway as well as the mix results for conventional gasoline (the same since there is only one pathway. The results can also be displayed and exported from the table view tab. | |||
[[File:WellToPumpResultsCG.png|thumb|700px|none]] | |||
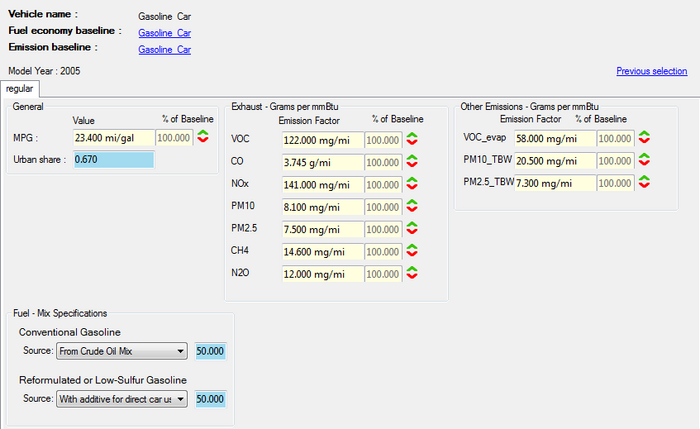
The "Pump to Wheels Setup" page allows setting up parameters for the vehicle that will be consuming the LDV resource in the simulation. The gasoline car includes parameters for the fuel economy, emissions, and the LDV fuel mixes to use. This vehicle is considered a baseline vehicle, that being other vehicles base their assumptions as a percent of this vehicle's values, so the up/down and share controls are disabled. | |||
[[File:PumpToWheelsSetupCG.png|thumb|700px|none]] | |||
Latest revision as of 17:04, January 17, 2012
How to Install and Run GREET
Running GREET
To run GREET simply run the GREET executable file from a file browser or a shortcut. Running the executable will open the program and allow loading GREET project files. To gain easier access right click the executable and go to send to and then select Desktop (create shortcut).
Selecting Working Folder
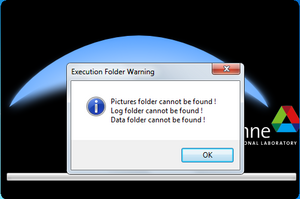
The processing and data files are separated to allow easily loading and saving multiple project files. After running GREET for the first time you will be asked to select the folder where these data files are stored.
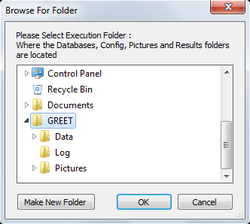
After selecting OK on the message a window will open for selecting the location of the data folders. Navigate to where the "Pictures","Log", and "Data" folders are on your system and select the folder directly above these folders then select OK. The program will load the data files and display the graphical user interface (GUI).
Copying/Moving Data Folders
To copy the data folders to a new directory select copy on the directory containing the "Data", "Log", and "Pictures" folders and paste it to a new location. This allows customizing where on the computer the program/data is stored.
Using the GUI
The GUI separates the key points of setting parameters and viewing results into various controls accessible through the buttons at the top of the main GUI window.
This image shows the main navigation of the program. Each of the main views can be selected by clicking one of the large buttons on the step bar. In the toolbar the "File" dropdown exposes options for loading and saving GREET projects. The "Results" dropdown shows options for manually recalculating the results and monitoring values. From the "Preferences" dropdown the preferences window can be shown and the table editor can be opened. From the "About" dropdown database information can be viewed, the software can be updated, and the help pages can be opened.
Preferences
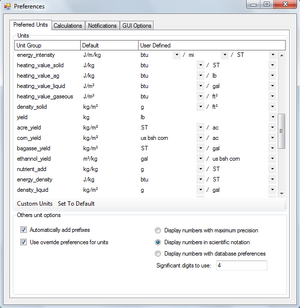
The main preference pages are the unit and calculation preferences accessible through their associated tabs within the preference window. The unit page, visible below, allows selecting desired units for various groups. Changing the value in the User defined column will cause values of that unit group to be displayed with the selected unit. If a group is made up of multiple units groups then the units can be changed within each group. An example of this is the first unit in the image below where Energy Intensity is composed of Energy over Distance over Mass.
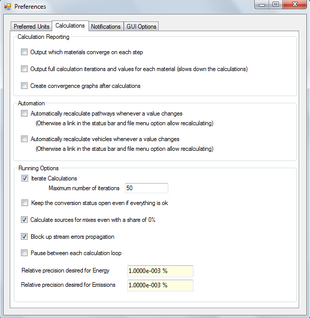
The calculations tab provides various options for controlling how the calculations are executed and displayed. The "Running Options" group of options allows changing calculation parameters such as the maximum iterations to run for calculating upstream values.
Main views
This image shows the main views, mousing over a button will display the text as shown or displaying the images can be disabled from the preferences.
Basic Parameter Setup
This control allows modifying many of the simulation parameters within various tables such as which year to simulate. The tables have a title explaining more about what the table is used for and the cells display the various values. A light blue cell indicates that the value comes from a formula referencing other table values which can be viewed or modified by right clicking and selecting "Edit Formula". Each value stores a default number and an current number which can be swapped by selecting "Switch to default value" and "Switch to user value" from the right click menu. This allows making changes and easily returning to a default value. For most cells the value has an associated unit which can be modified from the right click menu by selecting "Change Unit" and then selecting the desired units.
Well to Pump Setup
This allows viewing and modifying parameters specific to processes as well as pathways.
Pathway Selection
The tree selection in the top left allows selecting a pathway which are organized into light duty vehicle (LDV) fuels, feedstocks, and others. Fuels that make up a family of actual fuels are denoted by a lighter teal color such as Diesel and Gasoline which have multiple fuels under those names. Under each fuel are mixes which represent a particular blend of fuels. Under each mix is one or more pathways which output a fuel that goes into the mix and next to it is the share that the fuel contributes to the mix.
Pathway Representation
The large panel on the right with boxes is a graphical representation of the selected pathway. If the pathway has a fuel that feeds into it then the feed panel will be on the left denoted by a light orange background. After the calculations have been run this panel displays a summary of energy and emissions for the feed mix when the mouse is moved over it. Clicking the title link will display the feed pathway and the back button on the pathway selection control allows returning to the previous pathway.
To the right of the feed are the processes with Stationary Processes showing with a light blue background and Transportation Processes with a pink background. Double clicking a Stationary Process expands the process to display the process fuels consumed in the process and if a fuel has technologies associated with it then it can be expanded to view the technologies. Double clicking a transportation process expands the process to display a graphical representation of the locations and modes that represent the transporting of the material to the destination. Double upward arrows next to a process represent a loss (leakage or boil-off) which can be displayed by clicking the arrows. Various parameters can be set for each process and the titles in blue can be used to open a window with more parameters for that object.
Property Display
The bottom left control displays properties for the selected object in the pathway representation. The pathway summary can also be display by clicking the "Switch to pathway" button. The emissions section displays how much of each gas emission is released and is also broke down intro all included and partial upstream.
For ease of use the emissions are shown in the groups criteria pollutants, emission gases, from combustion, and greenhouse gases. The energy is broken down into upstream included and partial upstream as well as displaying energy per process fuel. In addition it is grouped into fossil, petroleum, natural gas, coal, non fossil, nuclear, and renewable fuels. If a loss is as is associated with the selected process then it will display in the losses section.
Well to Pump Results
The well to pump results allow viewing and comparing the energy usage and emission results for each of the pathways in each of the mixes for a LDV fuel.
The tabular version of the results displays the energy usage and emissions for each pathway as well as the weighted average of the values based on the share of each pathway. The pathways that are displayed depends on what is selected on the left material selection control. If the resulting material is selected then each pathway within each mix is displayed on the right as well as the weighted results for the mix. The column header represents this by starting with either "PATH" for pathway results or "SRC" for the mix results. Selecting a single pathway will display the energy used and emissions for each process within the pathway each denoted by "PROC" in the result table. The results can be exported by right clicking and selecting "Copy to Clipboard" or "Save to XML File". Once copied the results can either be pasted into Excel or a text editor.
The graphical format of the results allows seeing the pathways as they feed into a mix of the resulting LDV fuel. Each of the pathways display on the left of the graphic with their name and share amount as well as the emissions displayed on the left of the panel and the energy displayed on the right. The source box then shows the weighted mix results from combining the output of the pathways.
Pump to Wheels Setup
This control allows setting assumptions for vehicles to be used in the well to wheels simulation. The vehicles or sorted by the LDV fuel that they run on and can be selected from the list on the left. The parameters for that vehicle will display on the right.
A "normal" or "cs" vehicle displays parameters for a combustion engine vehicle as shown above. Many of the vehicles' parameters are based on a baseline vehicle in which case the "% of baseline" columns will be active and changes to values in emissions or miles per gallon will adjust the % of the baseline according for that parameter.
The "cd" control displays options for plug-in hybrid electric vehicles (PHEV). The primary attributes for PHEVs are the electric range, fuel consumption, electricity consumption, charging efficiency, and the source mix for electricity.
Well to Wheels Results
Data Editor
The controls in the data editor allow direct access to the data stored within the model including the pathways, processes, resources, and more. Many of the controls are linked to from other places such as clicking the name of a process within the well to pump setup and the resulting process editor being opened in a new window.
For detailed information on any of the controls see the Full User Manual under Data Editor.
Example study
Gasoline Production - Well to Wheels
This part of the guide will run through carrying out a simulation for production of gasoline and combustion in a gasoline car.
First start with the "Basic Parameter Setup" and look through the simulation parameters for tables related to conventional gasoline as well as general parameters. This simulation will use the default simulation year of 2010 which is in the "single parameters" tab. Next look through the "Materials Calculated Parameters" tab for Conventional Gasoline which shows assumptions about the fuel. If you have different assumptions for the density or heating value they could be inputted here. Also note the "Other Options" section to the left of the tables as this option determines whether the lower heating value or upper healing value is used for calculations.
The "Transportation Calculated Parameters" table can be used to set parameters for the modes of transportation for the fuel such as average speed and load factor of an ocean tanker carrying crude oil. Additional mode options can be accessed from the data editor under "Edit Modes".
Moving to the well to pump setup control from the top navigation bar, the Gasoline mixes are found under the "Gasoline" group in the pathway selection. Navigating down to a mix under "Conventional Gasoline" it shows that there is currently one mix stored called "From Crude Oil Mix" and selecting it displays the pathway.
By hovering the mouse of the Feed box, which is tan colored, the energy and emission results for the feed mix pathways are displayed in a drop down summary of the pathways. Clicking the feed name redirects this control to the first feed pathway and selects displays the mix in the pathway selection. Doing this for this CG feed there are three pathways in the mix that feeds into the "From Crude Oil Mix", those being conventional crude oil at 90.6%, crude oil from oil sands at 4.7%, and crude oil from surface mining at 4.7%. The shares show how much weight each pathway has on the results for that mix.
Clicking the back button brings me back to the CG pathway where three processes are visible. The stationary processes, the light blue ones, can be expanded by double clicking in order to set parameters for the process fuels and their technologies.
Expanding a transportation process, the pink colored processes, displays the transportation breakdown for the fuel. The starting locations where the conventional gasoline is being moved from are displayed at the far left followed by a series of transportation modes for representing how the resource will be moved. The distance can be set for the estimated distance that mode will travel, the share specifies how much of the total transported material will be moved using that mode, and clicking the mode name link will open a form for setting other parameters such as fuel shares and energy intensities.
At the bottom left the results for various objects can be displayed. Simply select a process, input under a process, or transportation step to view the emissions and energy used for that object. The "Switch to Pathway" button can be used to go back to the pathway results.
Moving to the "Well to Pump Results" page shows the cumulative emissions and energy used for the Crude oil mix to conventional gasoline pathway as well as the mix results for conventional gasoline (the same since there is only one pathway. The results can also be displayed and exported from the table view tab.
The "Pump to Wheels Setup" page allows setting up parameters for the vehicle that will be consuming the LDV resource in the simulation. The gasoline car includes parameters for the fuel economy, emissions, and the LDV fuel mixes to use. This vehicle is considered a baseline vehicle, that being other vehicles base their assumptions as a percent of this vehicle's values, so the up/down and share controls are disabled.
